
Plan Safer Commercial Lighting Before Installation
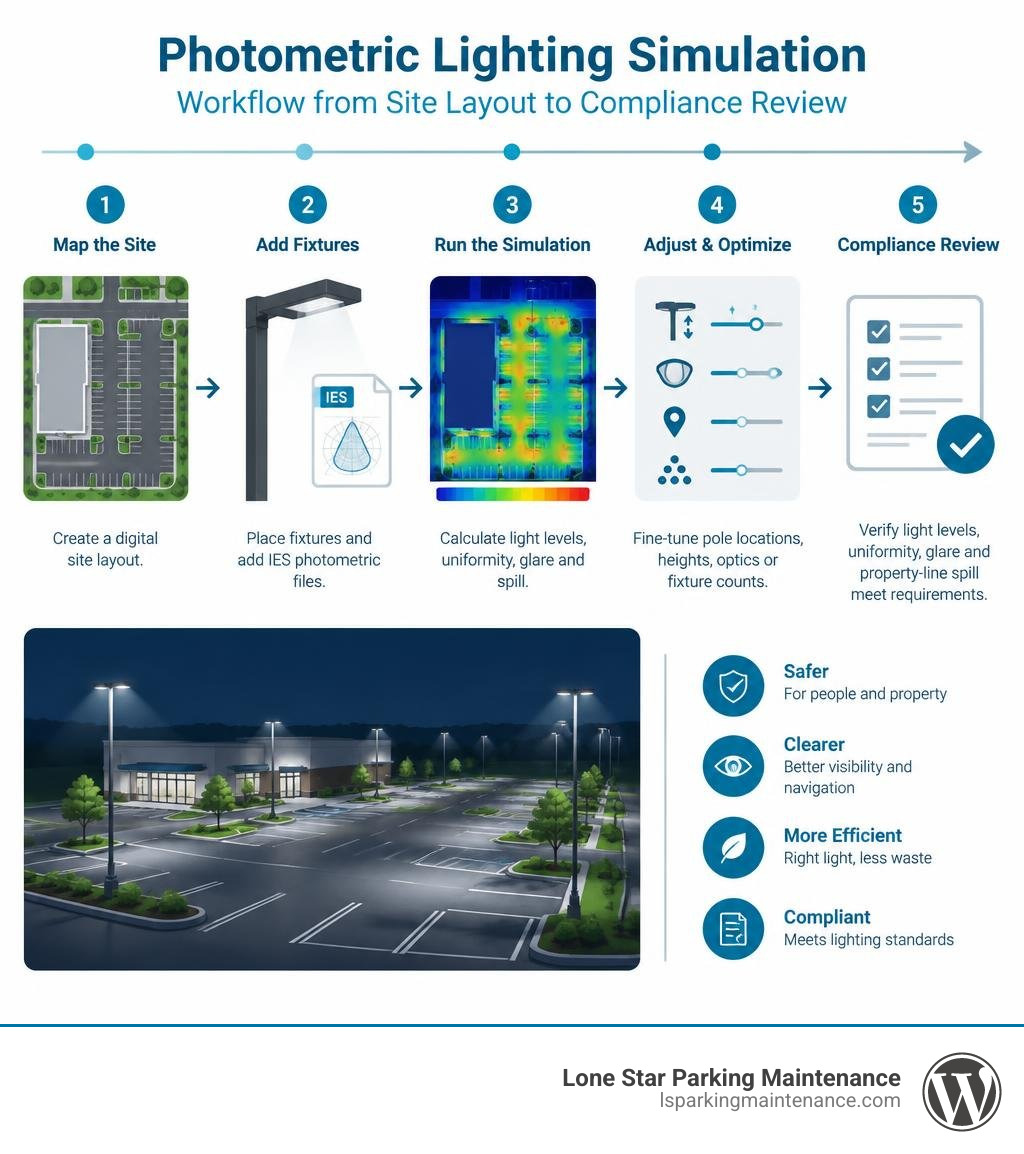
Photometric lighting design uses a digital model to show where light will land before fixtures are installed. For a commercial parking lot, the practical process is simple: map the site, add the proposed fixtures and their IES photometric files, then review light levels, uniformity, glare, and property-line spill. Adjust pole locations, mounting heights, optics, or fixture counts until drive lanes, parking stalls, walkways, and entrances are safely lit without wasting energy.
This matters because a bright-looking lot can still have dark gaps, harsh glare, or unwanted light reaching neighboring property. A photometric plan replaces guesswork with point-by-point foot-candle or lux calculations, so you can spot problems while they are still inexpensive to fix.
For context, one foot-candle equals 10.764 lux. Light levels also change quickly as coverage expands: the same 1,000 lumens creates 1,000 lux over one square meter, but only 100 lux when spread across 10 square meters.
I am Cason, and this guide will help you understand how to use photometric planning to make commercial properties safer, clearer, and more efficient.
Relevant articles related to photometric lighting design:
Understanding Photometric Lighting Design and Core Photometry Metrics
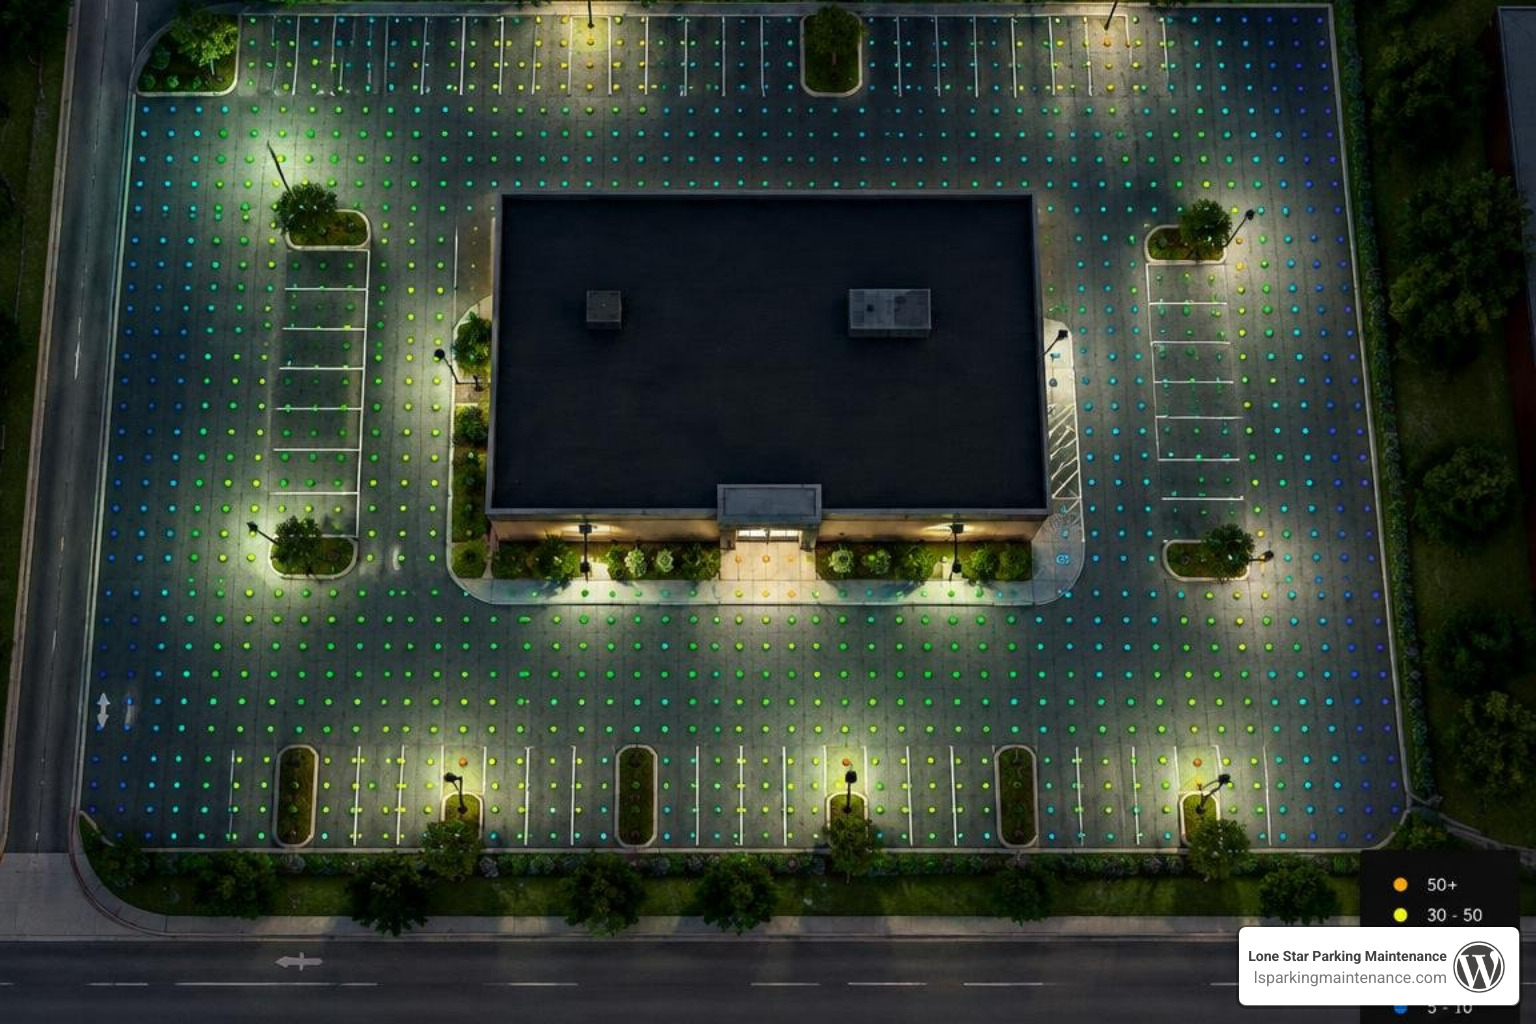
When we evaluate commercial properties across the DFW Metroplex, property managers often ask why their facilities feel dim despite installing high-wattage LEDs. The answer comes down to optical physics. Brightness at the fixture head does not automatically mean balanced illumination on the asphalt.
Photometry is the science of measuring visible light as perceived by the human eye. In commercial facility design, we evaluate how light emanates from a source, travels across space, and interacts with physical surfaces. Central to this behavior is the inverse square law: the intensity of light falling on a surface is inversely proportional to the square of the distance between that surface and the light source. If you double the mounting height of a parking lot pole from 15 feet to 30 feet, the light footprint spreads over four times the area, but the illuminance directly beneath it drops to one-fourth of its original strength.
Understanding this dynamic requires familiarity with standard photometric metrics:
| Metric | Measurement Unit | Practical Definition | Real-World Commercial Context |
|---|---|---|---|
| Luminous Flux | Lumens (lm) | Total quantity of visible light emitted by a fixture in all directions. | A standard 100-watt incandescent bulb emits 1,200 to 1,500 lumens. Commercial LED fixtures often emit 10,000 to 40,000+ lumens. |
| Luminous Intensity | Candela (cd) | Light power emitted in a specific, narrow direction. | Measures beam concentration, determining how well a luminaire punches through darkness toward a focal target. |
| Illuminance | Foot-Candles (fc) / Lux (lx) | Density of luminous flux hitting a specific surface area. | 1 fc = 1 lumen/sq ft (10.764 lux = 1 lumen/sq meter). Office interiors target ~50 fc (~500 lux); a sunny day reaches 10,000 fc (100,000 lux). |
| Luminance | Candelas per sq meter ($cd/m^2$) | Visual brightness reflected back from a surface into the eye. | Dictates visual glare, pavement contrast, and nighttime visibility for drivers and pedestrians. |
Foot-Candles, Lux, and Candela Defined
To interpret a digital lighting simulation, we must distinguish between horizontal and vertical illuminance.
- Horizontal illuminance measures the light falling flat on the ground plane, such as asphalt drive lanes, parking stalls, and crosswalks. It ensures drivers see pavement striping, potholes, and curbs.
- Vertical illuminance measures the light striking vertical surfaces, such as pedestrian bodies, building facades, and directional signage. High vertical illuminance allows people to recognize facial features from a safe distance and identify potential safety hazards.
In North America, commercial site plans measure illuminance in foot-candles (fc). One foot-candle represents the illuminance cast on a one-square-foot surface by a one-candela point source one foot away. Internationally and in scientific modeling, lux (lx) is the standard metric. Because one foot equals 0.3048 meters, converting foot-candles to lux requires multiplying by 10.764.
Achieving optimal visual comfort is not about maxing out foot-candles. Over-lighting an area creates extreme contrast ratios that blind drivers when transitioning from unlit public streets into a retail parking facility. High-performance planning targets specific, uniform lighting levels suited to the tasks performed on site.
The Critical Role of IES Files and Goniophotometer Data
Modern lighting calculations rely on digital fixture profiles known as IES files. Standardized in 1986 by the Illuminating Engineering Society (IESNA) under the LM-63 standard, an IES file is an electronic dataset containing geometric light distribution measurements. European projects often utilize the similar EULUMDAT (.ldt) format.
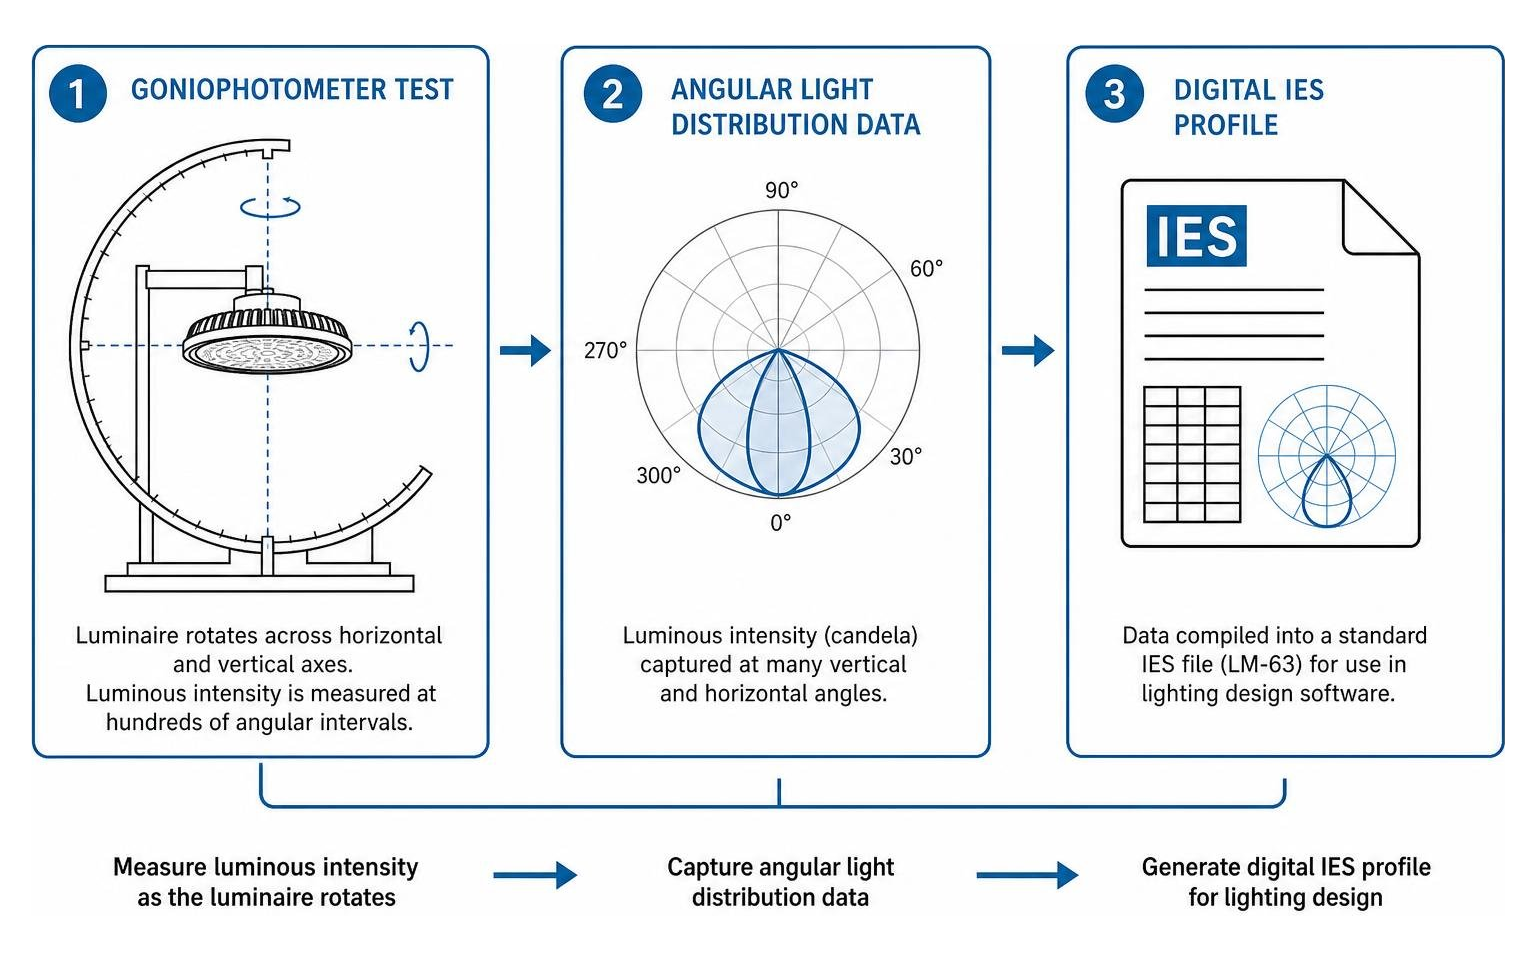
Manufacturers generate these files by mounting luminaires inside a specialized testing device called a goniophotometer. The goniophotometer rotates the fixture across horizontal and vertical axes, measuring luminous intensity at hundreds of angular intervals.
When a design engineer builds a digital site model, specialized software imports these IES profiles to construct an accurate 3D photometric web. This web dictates:
- Exact beam spread and field cutoffs.
- Directional peak candela angles.
- True lumen output accounting for internal reflector optics and secondary lensing.
Integrating realistic Photometric Light distribution profiles ensures the virtual model reflects exact physical realities.
Step-by-Step Process for Conducting a Photometric Light Study
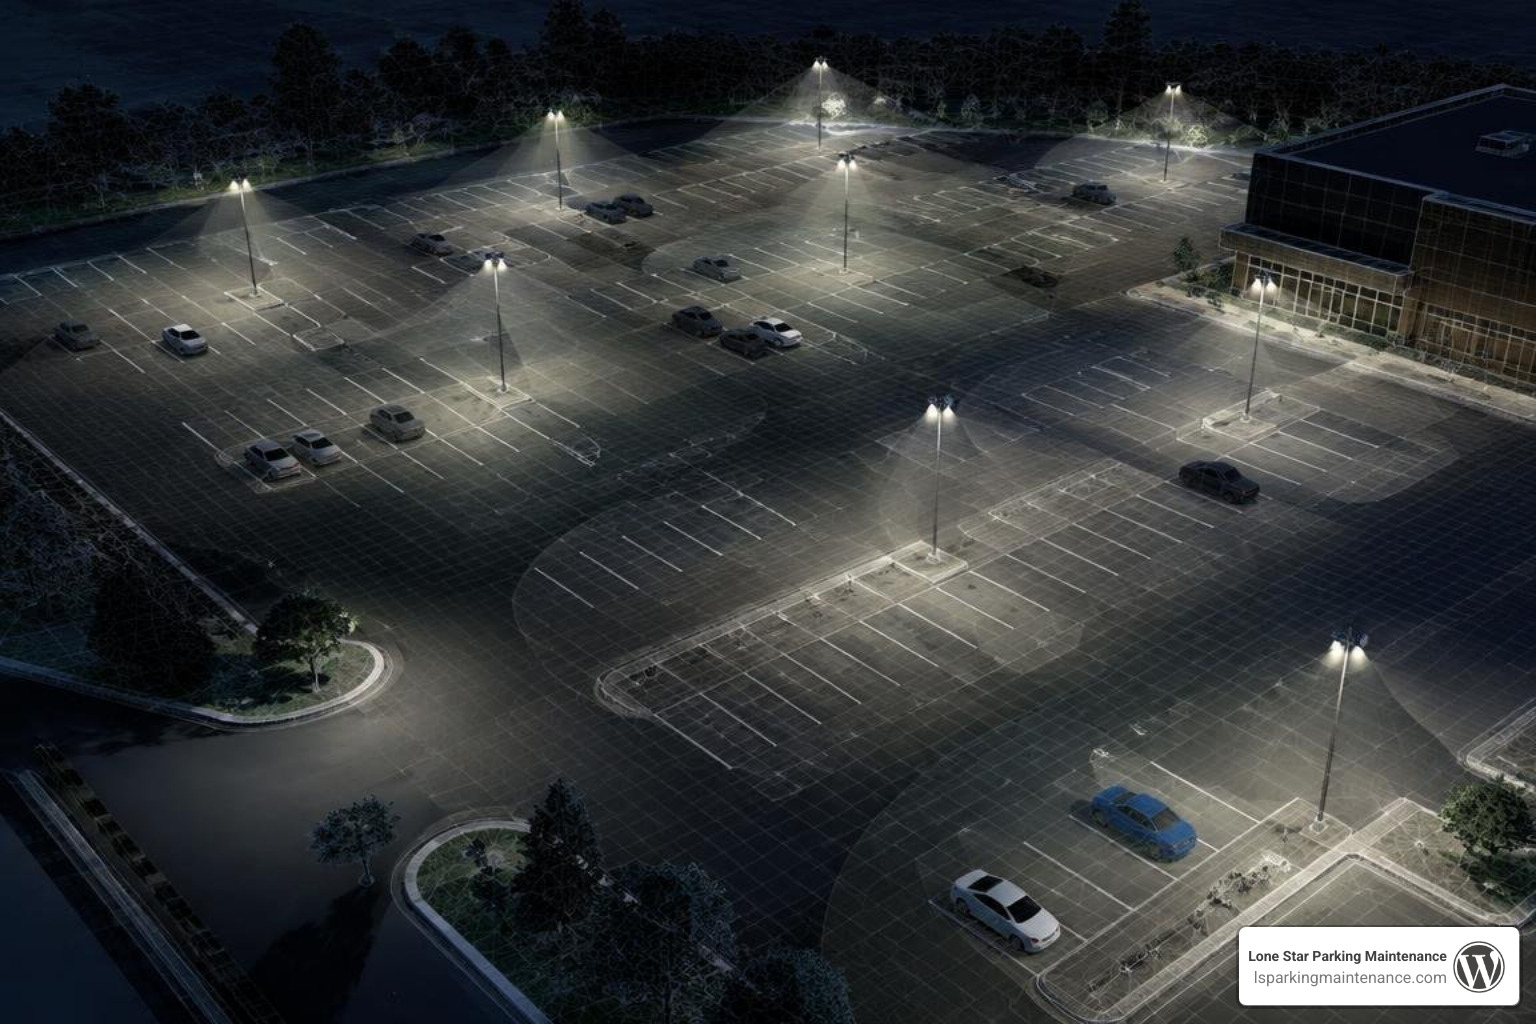
Guessing luminaire spacing based on fixture wattage leads to uneven lighting, harsh glare, and code violations. A formal photometric study eliminates trial-and-error by generating a 5- to 20-page engineering document detailing foot-candle grids, uniformity calculations, fixture schedules, and light trespass verifications.
Site Auditing, CAD Data, and Surface Reflectance
Every accurate simulation begins with comprehensive site data:
- Importing CAD Blueprints: Designers import scaled site plans (DWG or DXF formats) detailing curb lines, stall layouts, building footprints, pedestrian walks, and property boundaries.
- Mounting Heights and Pole Locations: Existing or proposed pole locations, mounting heights, arm lengths, and fixture orientations are mapped into 3D space.
- Surface Reflectance Modeling: Light interacts differently with different materials. Asphalt absorbs light (reflectance value ~0.07 to 0.10), while cured concrete reflects significantly more (~0.20 to 0.30). Factoring in reflectance prevents under-lit asphalt parking bays.
- Accounting for Physical Obstructions: Mature trees, architectural canopies, retaining walls, and neighboring buildings alter light paths and create dark pockets. Modeling these physical elements early prevents real-world visibility gaps.
Software Simulation and Point-by-Point Light Calculations
Once structural data is imported, engineers use industry-standard calculation software such as AGi32 or DIALux to calculate point-by-point illuminance across the site grid.
Designers configure calculation planes to Calculate General Photometrics based on defined project parameters:
- Point-by-Point Grid Spacing: The software places calculation points at uniform intervals (typically 5 to 10 feet apart across parking bays). Each point calculates the total light received from all surrounding luminaires.
- ISOline Contours: The program generates colored contour lines (isocharts) that connect points of equal foot-candle intensity, highlighting hot spots and dim valleys.
- Light Loss Factor (LLF): Real-world fixtures experience lumen depreciation over time due to dirt accumulation and component aging. Applying an LLF (typically 0.85 to 0.90 for commercial LEDs) ensures the system meets safety thresholds throughout its entire operating life.
- Uniformity Ratios: The software evaluates two critical ratios: Average-to-Minimum ($Avg/Min$) and Maximum-to-Minimum ($Max/Min$). While a lot might average an acceptable 2.0 foot-candles, a $Max/Min$ ratio exceeding 15:1 indicates severe light and dark pooling, which strains driver vision.
Commercial Applications for Maximum Safety and Security
Commercial property managers operate under significant liability exposure. Inadequate illumination contributes to slips, trips, vehicle collisions, and criminal activity. A balanced lighting plan creates an inviting nighttime environment while mitigating operational risk.
Implementing Photometric Lighting Design in Parking Lots and Garages
Surface parking lots and structured multi-level parking garages present distinct architectural challenges:
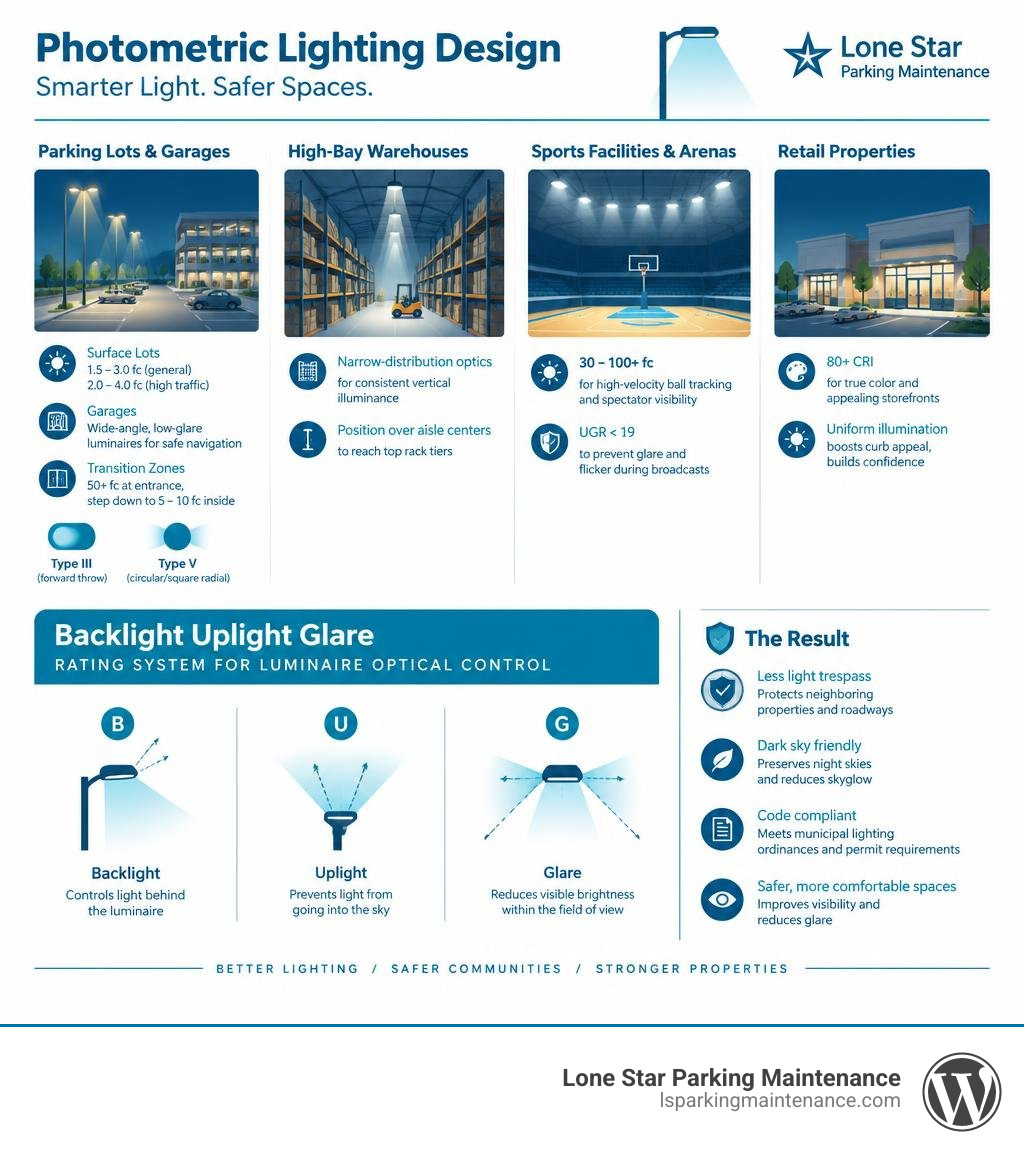
- Surface Lots: We target an average of 1.5 to 3.0 foot-candles across general parking bays, with higher minimums (2.0 to 4.0 fc) across high-traffic intersections, drive lanes, and pedestrian crosswalks. Utilizing IES Type III (forward throw) and Type V (circular/square radial) optics creates smooth, overlapping light footprints without harsh cutoff shadows between poles.
- Parking Garages: Low ceiling clearances demand wide-angle, low-glare luminaires to avoid blinding drivers navigating tight ramps. High-priority zones include stairwells, elevator lobbies, and vehicular entry portals.
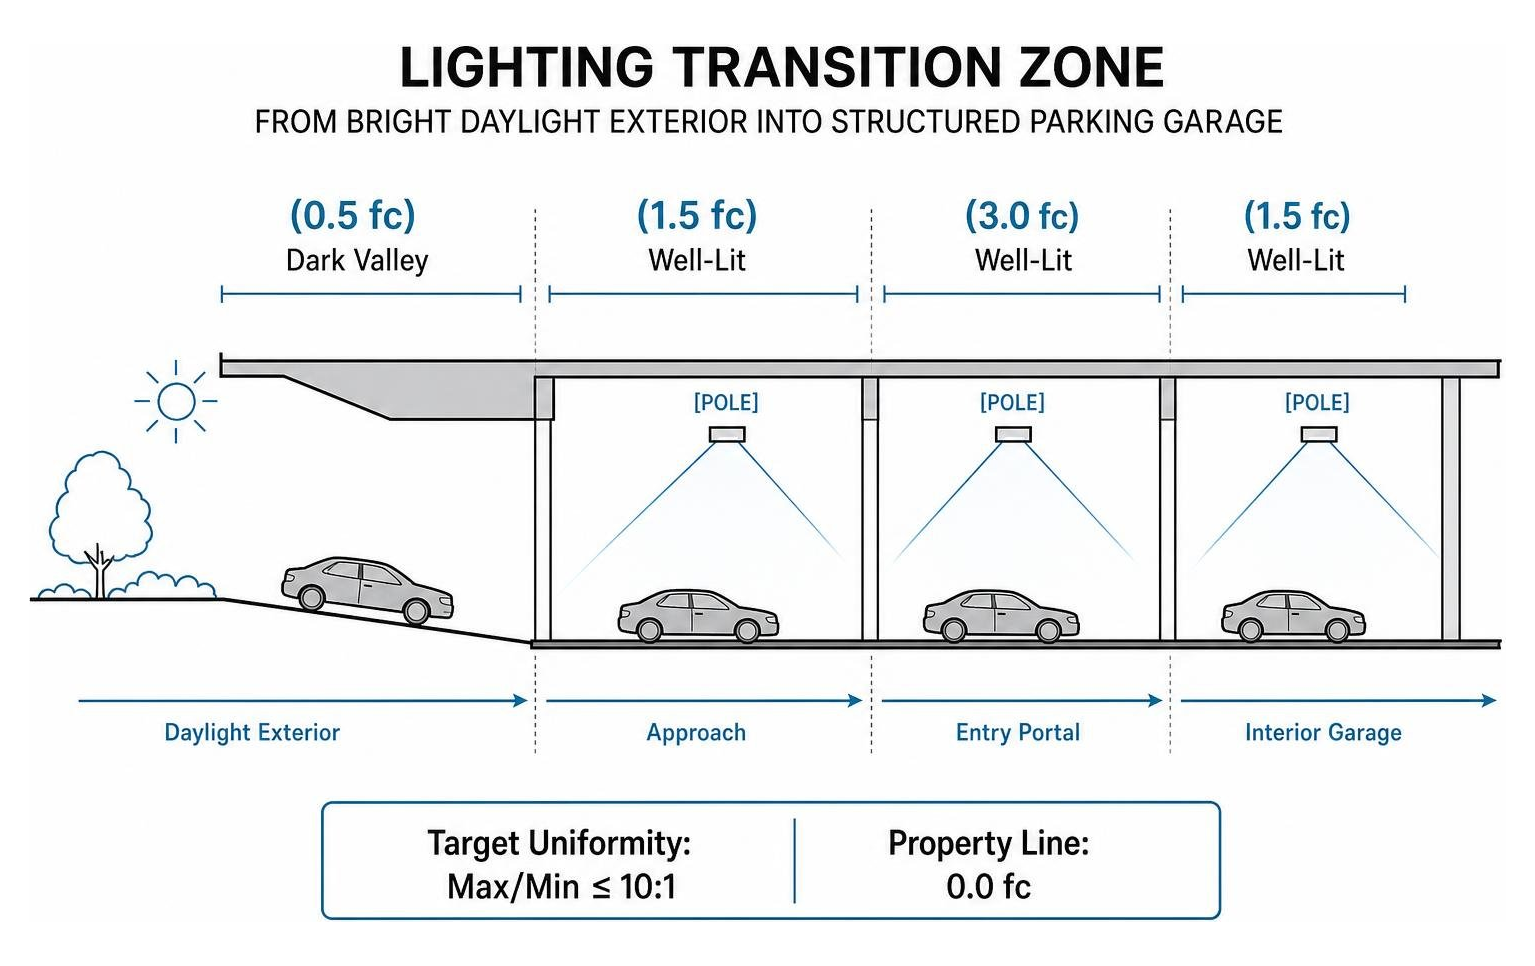
- Transition Zones: Sunlight can produce 5,000 to 10,000 foot-candles outside a garage entrance. Drivers entering during midday face temporary blindness if the interior portal is under-lit. Photometric modeling helps design daytime transition zones (50+ fc) that step down gradually to standard interior levels (5 to 10 fc).
High-Bay Warehouses, Sports Facilities, and Retail Properties
Beyond exterior parking lots, interior industrial and commercial spaces rely on photometric modeling to boost productivity and safety:
- High-Bay Warehouses: Tall pallet racking blocks horizontal light throw. Photometric calculations position narrow-distribution optical luminaires directly over aisle centers to achieve consistent vertical illuminance from the floor to the top rack tier.
- Sports Facilities and Arenas: High-velocity ball tracking and spectator visibility demand high foot-candle levels (30 to 100+ fc) paired with strict glare ratings ($UGR < 19$) to prevent athlete disorientation and flicker during video broadcasts.
- Retail Properties: Exterior retail facades and customer parking demand clean color rendering (80+ CRI) and uniform illumination to boost curb appeal, instill shopper confidence, and clearly define architectural pathways.
Navigating Code Compliance, Dark Sky Standards, and Light Trespass
Commercial property owners face strict municipal outdoor lighting ordinances. City code enforcement departments routinely require signed, sealed photometric plans before issuing building or electrical permits.
Preventing Glare, Up-Light, and Property Spill
The primary driver behind municipal lighting restrictions is the elimination of light trespass—unwanted artificial light spilling past the property boundary onto residential neighborhoods or public roadways.
Most local municipal codes in Texas prohibit light spill exceeding 0.1 to 0.5 foot-candles at the property line, with many demanding absolute zero spill ($0.0\text{ fc}$) along residential property boundaries.
To standardize optical control, the lighting industry uses the BUG rating system (IES TM-15-11):
- B (Backlight): Measures light directed behind the luminaire toward the rear property line.
- U (Uplight): Measures light directed upward above the horizontal plane ($90^\circ$ to $180^\circ$), which contributes to artificial skyglow.
- G (Glare): Measures high-angle forward light ($60^\circ$ to $90^\circ$) that causes visual discomfort or disables driver vision.
Full-cutoff, Dark Sky-compliant fixtures focus 100% of their luminous flux downward ($U=0$). Modern fixtures can be fitted with house-side shields and internal optic deflectors to cut light throw sharply at site boundaries, eliminating neighbor complaints and municipal fines.
Best Practices for Compliant Photometric Lighting Design Plans
Achieving fully compliant, energy-efficient commercial layouts requires a structured engineering approach:
- Review Local Ordinances First: Identify maximum allowable mounting heights, curfew dimming requirements, and property-line foot-candle limits before placing poles.
- Verify Emergency Egress Lighting: Building codes require dedicated emergency lighting along designated interior and exterior paths of egress, maintaining a minimum of 1.0 foot-candle along the path during power interruptions.
- Optimize Lighting Power Density (LPD): Energy codes (such as ASHRAE 90.1 and IECC) dictate the maximum allowable wattage per square foot. Photometric simulations allow you to hit target foot-candles using the lowest possible luminaire wattage.
- Deliver Long-Term Financial ROI: Upgrading legacy metal-halide or high-pressure sodium fixtures with an engineered LED layout routinely yields a 60% to 70% reduction in lighting energy consumption, while cutting ongoing maintenance costs.
Frequently Asked Questions About Commercial Photometrics
What is the difference between foot-candles and lux on a lighting plan?
Foot-candles (fc) and lux (lx) both measure illuminance (the amount of visible light hitting a surface). The difference lies in the unit of area used. Foot-candles measure lumens per square foot (the primary standard in the United States), whereas lux measures lumens per square meter (the international SI metric). Because one square meter equals approximately 10.764 square feet, $1\text{ fc} = 10.764\text{ lx}$. If an architectural plan requires 20 lux for an exterior walkway, that translates to approximately 1.86 foot-candles.
Why is dark sky compliance necessary for commercial exterior lighting?
Dark Sky compliance reduces urban skyglow, protects nocturnal wildlife ecosystems, prevents light trespass into residential neighborhoods, and saves energy. By specifying fixtures with zero up-light ($U0$) and fully shielded optics, all emitted light is directed down onto target driving and walking surfaces rather than being wasted into the night sky.
How does a photometric simulation prevent municipal code violations?
A digital photometric simulation models your exact property boundaries, fixture optics, and mounting heights before purchasing equipment. The generated point-by-point grid proves to municipal building officials that light levels meet minimum safety thresholds without exceeding maximum property-line spill limits (such as the standard 0.0 to 0.1 fc boundary cap). This prevents costly permit delays, project hold-ups, and the expense of moving installed light poles.
Precision Lighting Planning for Safer Facilities
High-performance commercial lighting is an exact science. Guessing fixture placements or swapping legacy lamps for high-output LEDs without an optical model creates visual glare, hazardous shadow pockets, neighborhood disputes, and municipal fines.
Investing in a digital photometric study provides a verifiable blueprint for your property. It ensures balanced ground-plane illuminance, sharp property-line cutoffs, and optimized energy efficiency, protecting your customers, employees, and bottom line.
At Lone Star Parking Maintenance, we help facility managers and property owners across the DFW Metroplex build safe, clean, and fully compliant facilities. From precision pavement marking and asphalt maintenance to comprehensive site solutions, we deliver high-quality results built to industry standards.
Contact our team today to discuss your next property upgrade and discover how expert commercial parking facility maintenance can elevate your commercial site.